While at a previous company, a few days before an ISMS certification audit I had to write a server inspection report for the first time. These are the notes I kept. We used CentOS, and without a monitoring system yet I looked up and ran commands one by one.
Checklist
- Log retention status
- System logs
- Security logs
- CPU usage
- RAM usage
- HDD usage
- System load
- Process health
- Backup log operation
- Application logs (WEB/WAS, DB, and so on)
Linux commands used
Check open ports
telnet "SERVER_IP" "PORT"SSH access
ssh "username"@"SERVER_IP"If you see a warning like Remote host identification has changed!, run:
ssh-keygen -R "SERVER_IP"Commands by checklist item
| Item | How to check |
|---|---|
| Log retention status | System: vi /var/log/messagesSecurity: vi /var/log/secureScheduler: vi /var/log/cronBoot: vi /var/log/boot.logLogged-in users: vi /var/log/utmpLogin: vi /var/log/wtmpFailed login: vi /var/log/btmpFTP: vi /var/log/xferlog |
| System logs | dmesg |
| Security logs | Current users: whoLogin/logout: lastFailed login: lastbFTP: vi /var/log/xferlog |
| CPU usage | top |
| RAM usage | free -g |
| HDD usage | DISK_USED=`df -P | grep -v ^Filesystem | awk '{sum+=$3} END {print sum/1024/1024}'`DISK_TOTAL=`df -P | grep -v ^Filesystem | awk '{sum+=$2} END {print sum/1024/1024}'`DISK_PER=`echo "$DISK_USED/$DISK_TOTAL*100" | bc -l`echo "$DISK_PER %" |
| System load | uptimecat /proc/cpuinfo | grep processor |
| Process health | Zombie: ps -ef | grep defunctDead: ps -ef | grep dead |
| Application logs | For WEB/WAS, check live logs for errors (exceptions). For Oracle, check the alert log and tablespaces. |
| Backup logs | vi /home/oracle/orabak/ |
Oracle inspection notes
Oracle capacity
select 'Total ' || ROUND(sum(bytes)/1024/1024/1024) || ' GB' from dba_data_files
union
select 'Used ' || ROUND(sum(bytes)/1024/1024/1024) || ' GB' from dba_segments
union
select 'Free ' || ROUND(sum(bytes)/1024/1024/1024) || ' GB' from dba_free_space;
Tablespace capacity
select  substr(a.tablespace_name,1,30) tablespace,
        round(sum(a.total1)/1024/1024,1) "TotalMB",
        round(sum(a.total1)/1024/1024,1)-round(sum(a.sum1)/1024/1024,1) "UsedMB",
        round(sum(a.sum1)/1024/1024,1) "FreeMB",
        round((round(sum(a.total1)/1024/1024,1)-round(sum(a.sum1)/1024/1024,1))
        /round(sum(a.total1)/1024/1024,1)*100,2) "Used%"
from
(select  tablespace_name,0 total1,sum(bytes) sum1,max(bytes) MAXB,count(bytes) cnt
  from    dba_free_space
  group by tablespace_name
  union
  select  tablespace_name,sum(bytes) total1,0,0,0
  from    dba_data_files
  group by tablespace_name) a
group by a.tablespace_name
order by tablespace;
Alert log
Example: scheduler error while running a procedure.
| Item | Detail |
|---|---|
| Log | Errors in file app/oracle/diag/rdbms/test/test/trace/test_j000_223947.trc:ORA-12012: error on auto execute of job "test"."JOB_SP_CUST_INAC"ORA-06550: line 27, column 23:PLS-00905: object test.SP_CUST_INAC is invalidORA-06550: line 27, column 23:PL/SQL: Statement ignored |
| Cause | Test scheduler error |
| Result | Removed the scheduler job |
Install FTP monitoring on the test server
While reviewing test-server logs there were no FTP access logs, so I installed vsftpd.
yum list installed | grep ftp
yum installed vsftpd -y
In the config file, set listen=YES and listen_ipv6=NO.
vi /etc/vsftpd/vsftpd.confOpen the firewall and enable the service:
firewall-cmd --permanent --zone=public --add-port=21/tcp
firewall-cmd --permanent --zone=public --add-port=22/tcp
systemctl enable vsftpd
systemctl start vsftpd
systemctl status vsftpd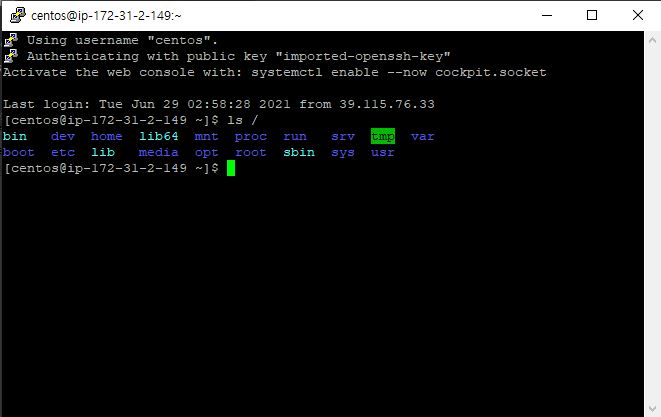
Leave a Reply