This covers installing Apache JMeter, the most well-known load testing tool, and running a simple test.
Download from Apache:
https://jmeter.apache.org/download_jmeter.cgi
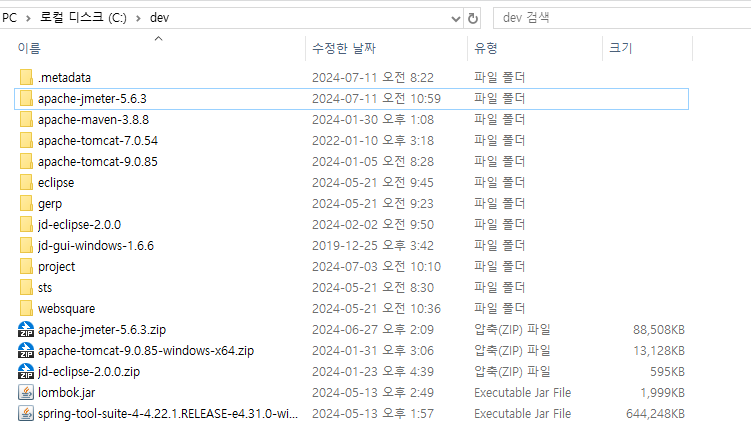
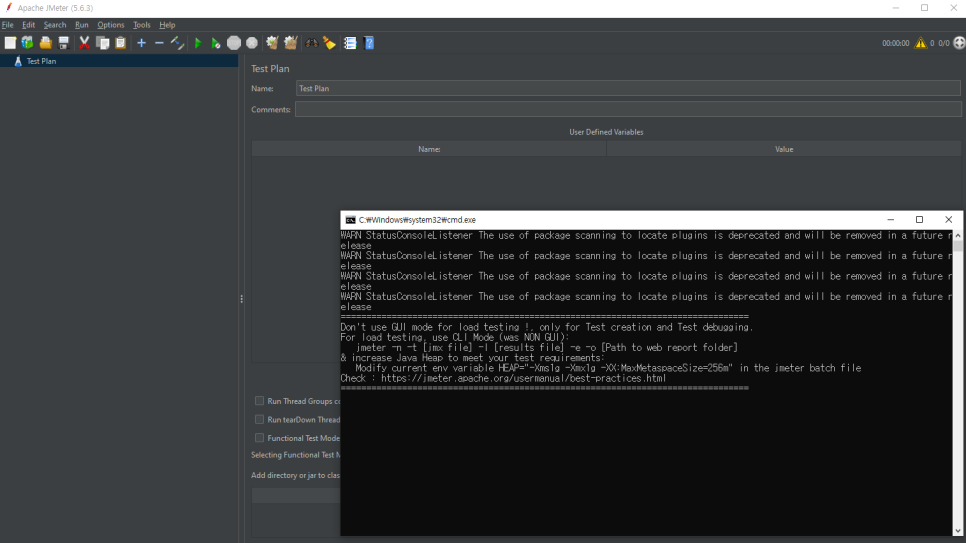
I am on Windows, so I downloaded the ZIP and placed it next to my project sources and Apache Tomcat. On my PC that is C:\dev\apache-jmeter-5.6.3\bin. Run jmeter.bat and a command window opens while JMeter starts (closing the cmd window stops JMeter).
Simple HTTP signup load test
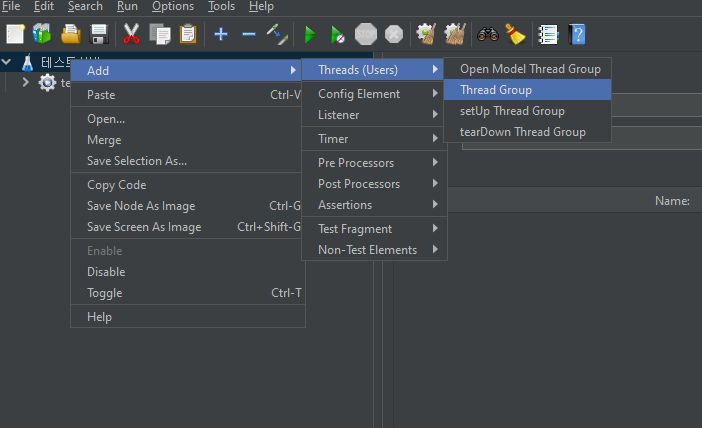
Right-click the Test Plan and add a Thread Group (I already had one named test).
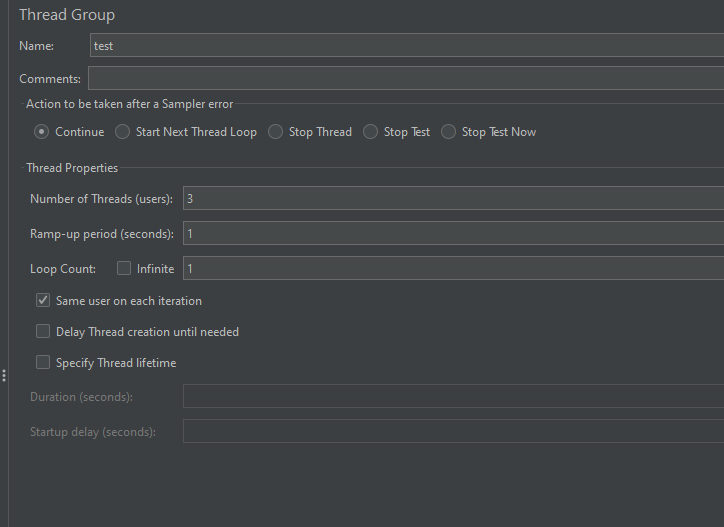
Thread Group properties:
- Number of Threads: concurrent users
- Ramp-up period: delay between starting those users (seconds)
- Loop Count: how many times each thread repeats
For this test I set it to send only 3 requests.
Add a Counter
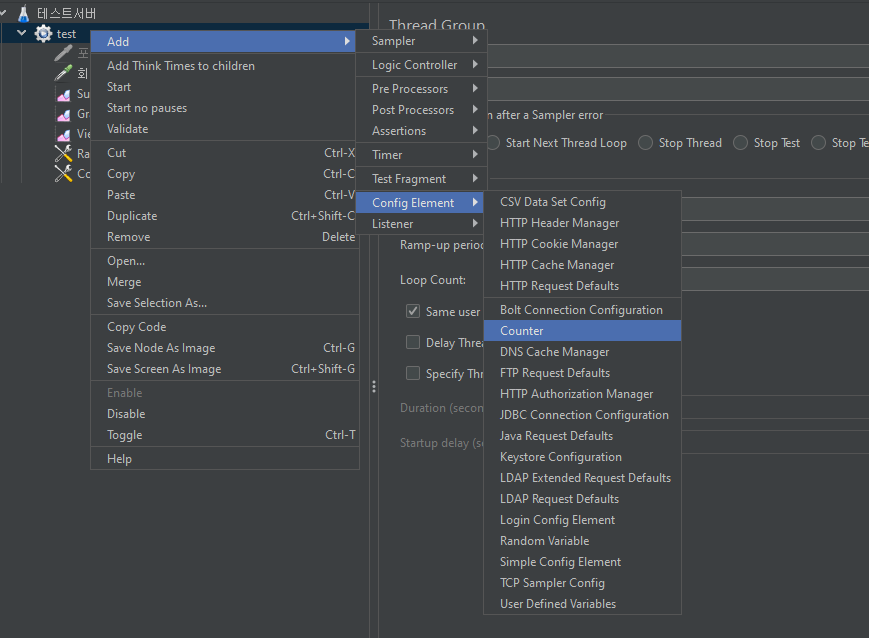
Right-click the Thread Group and add a Counter. For load testing I wanted about 100 signup requests, but a PK column would reject duplicate data as already registered. The Counter (auto increment) avoids that.
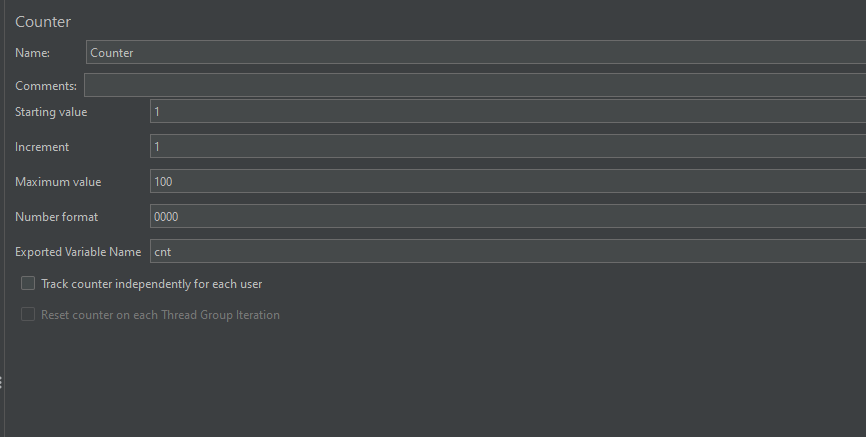
The name used in the request format is cnt, generating numbers 1-100 with format 0000 (for example 0001, 0002, … 0100).
HTTP Request
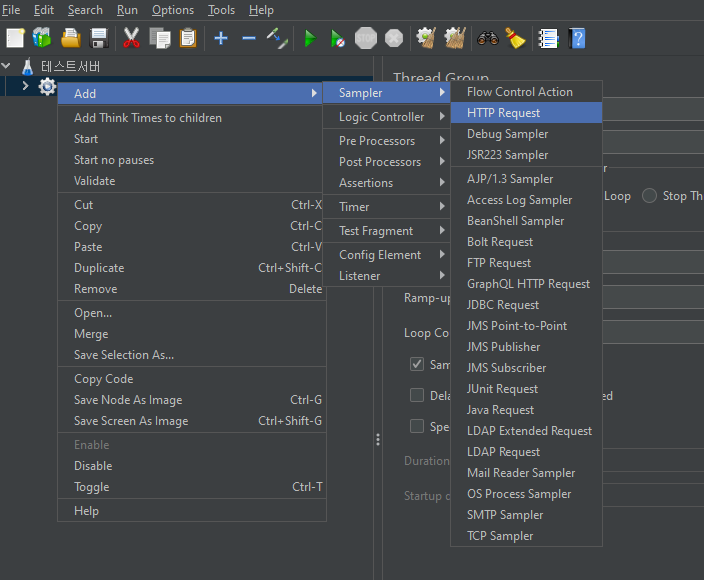
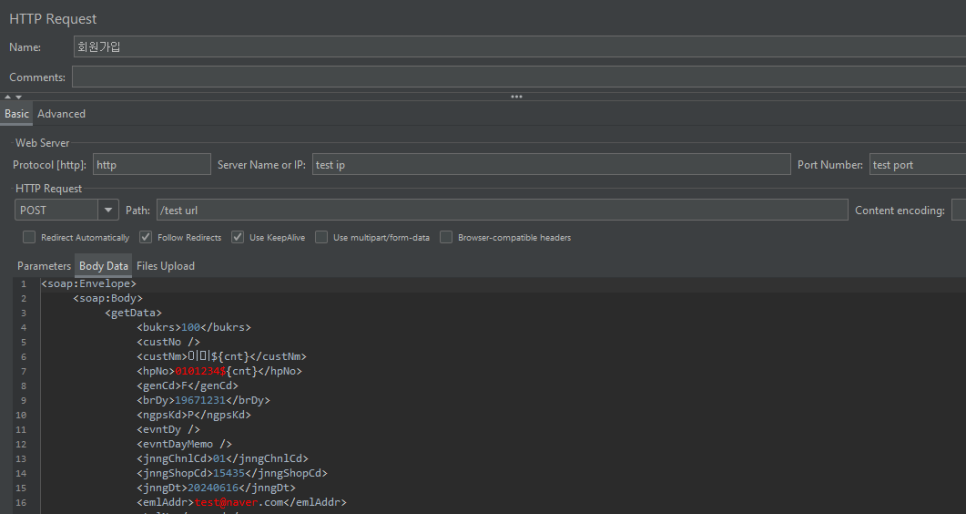
Right-click the Thread Group and add an HTTP Request. Set protocol (http/https), IP, port, and path to match your API.
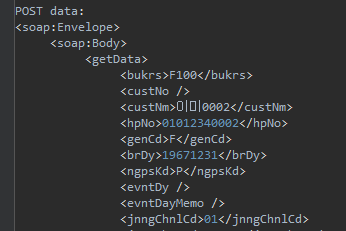
For member name (custNm) and phone (hpNo), use the Counter as ${cnt}. The 0000 format was chosen because of the phone field.
Listeners / reports
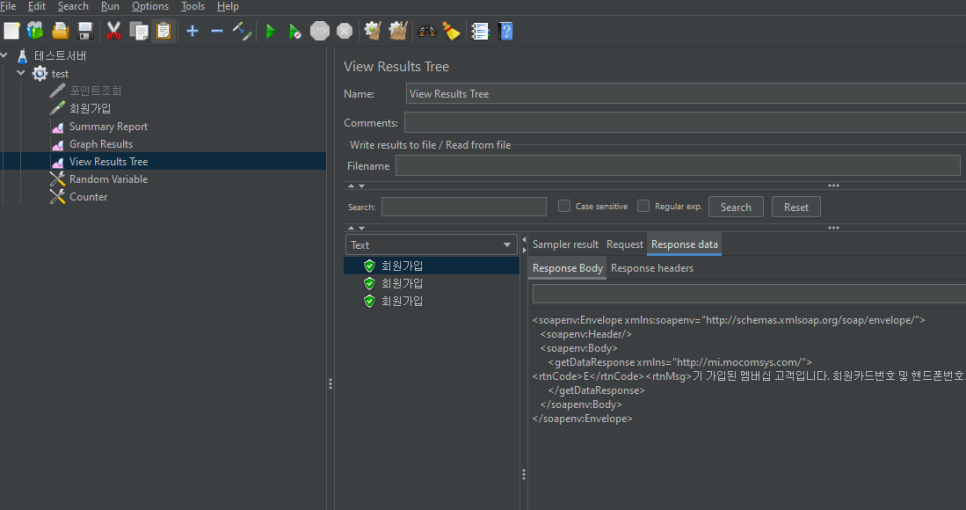
Add report listeners by right-clicking the Thread Group. I usually keep View Results Tree selected and run from there.
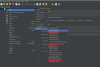
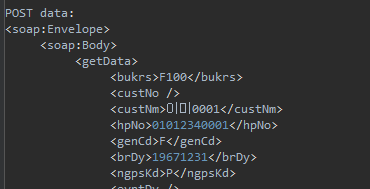
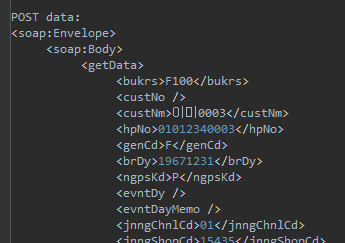
With 3 loops, counters such as 0001, 0003, and 0002 were used.
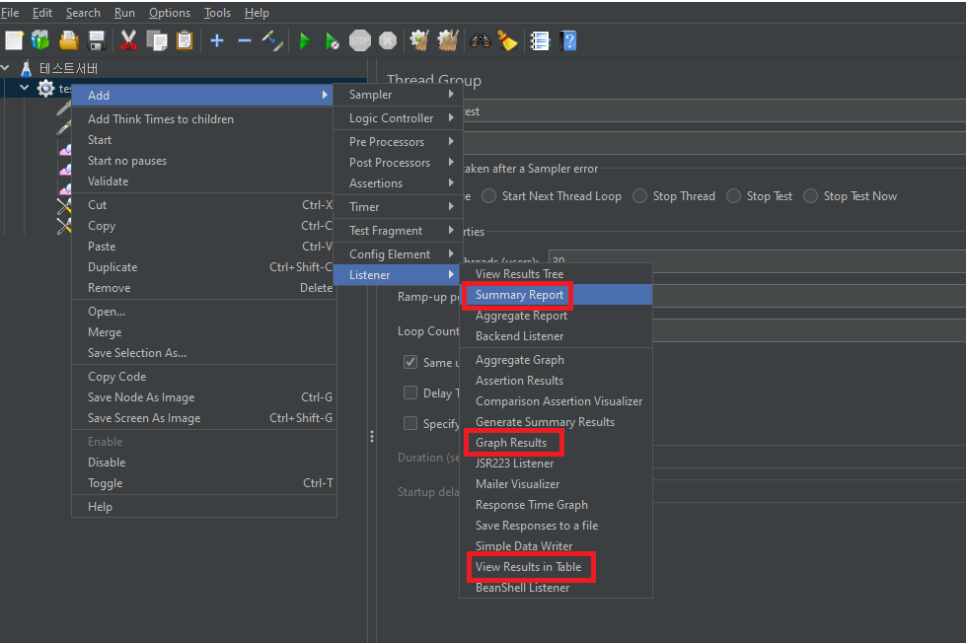
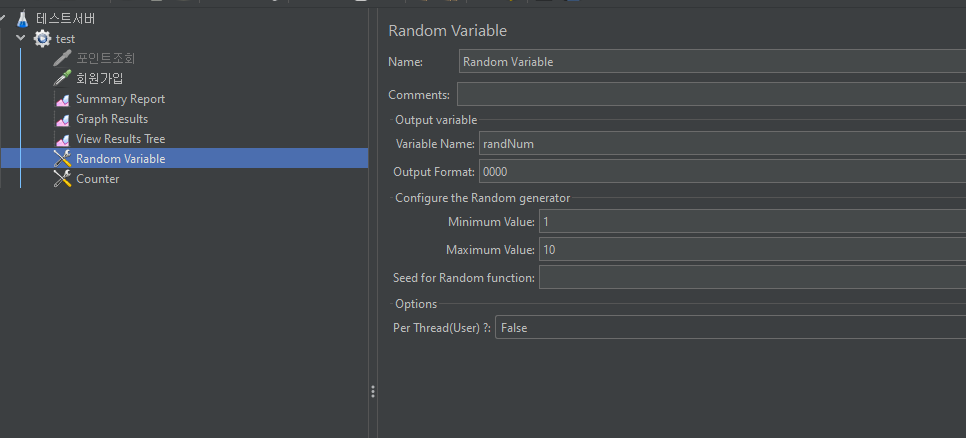
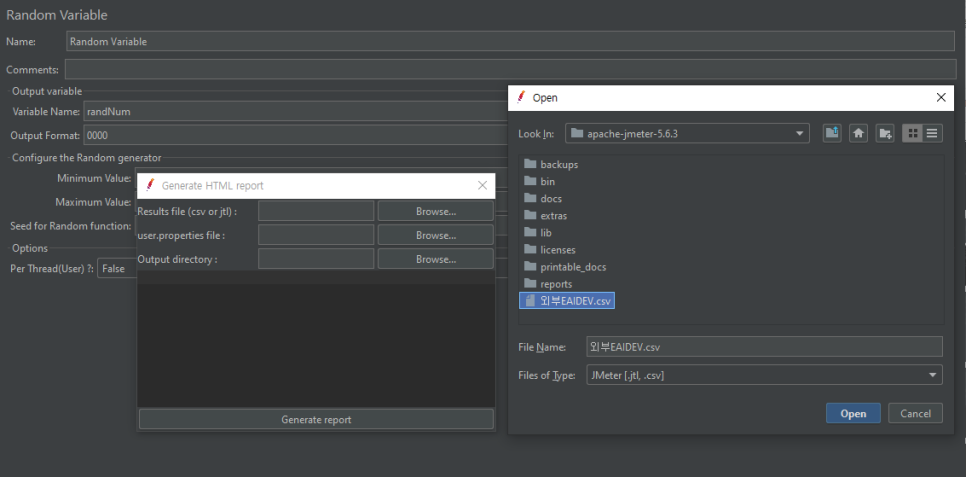
If you need a random value that allows duplicates, add Config Element -> Random Variable the same way as the Counter, then reference it in the HTTP request as ${randNum}.
HTML report
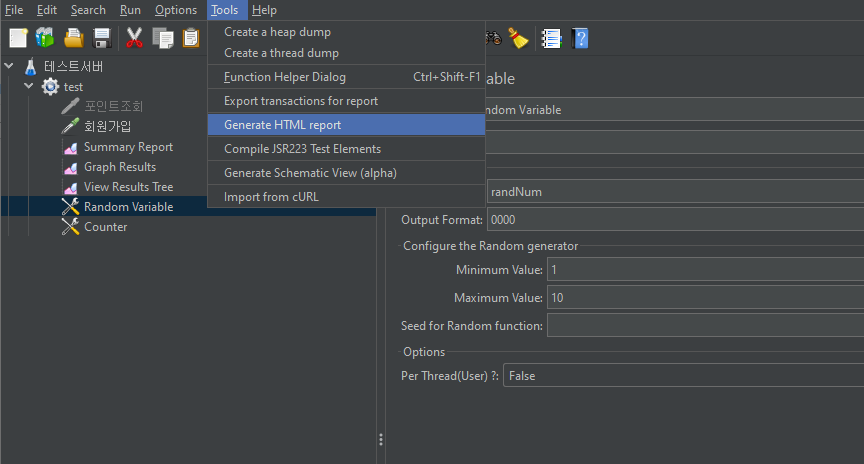
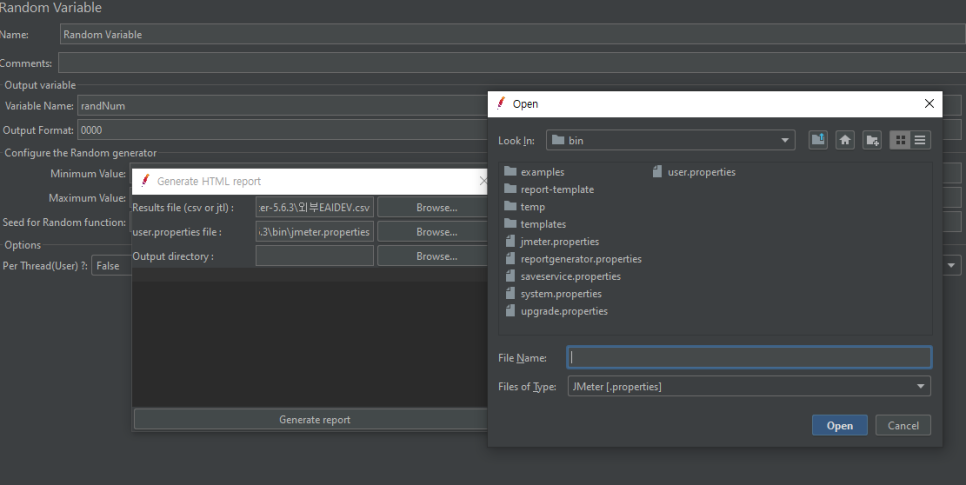
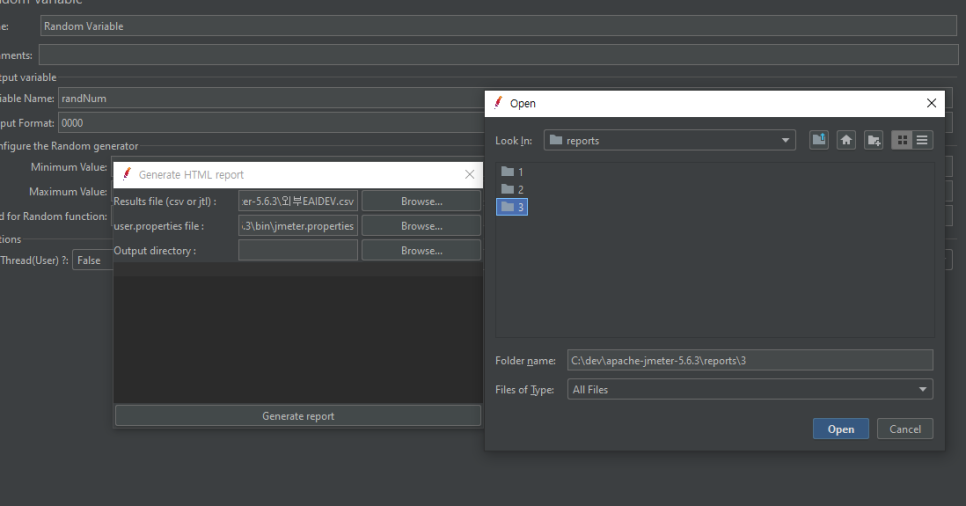
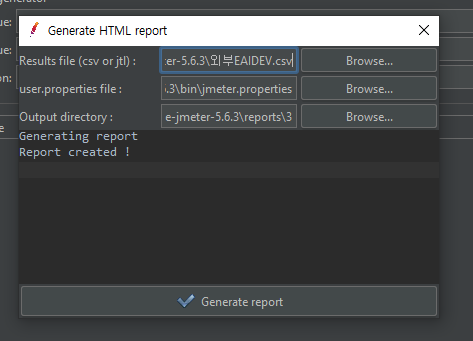
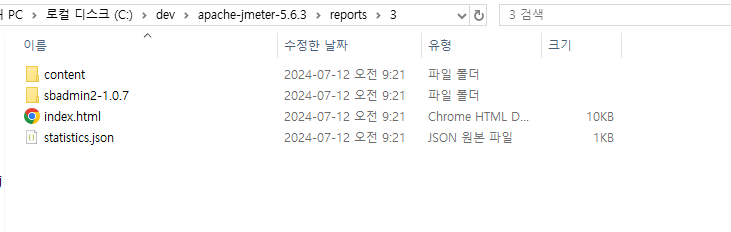
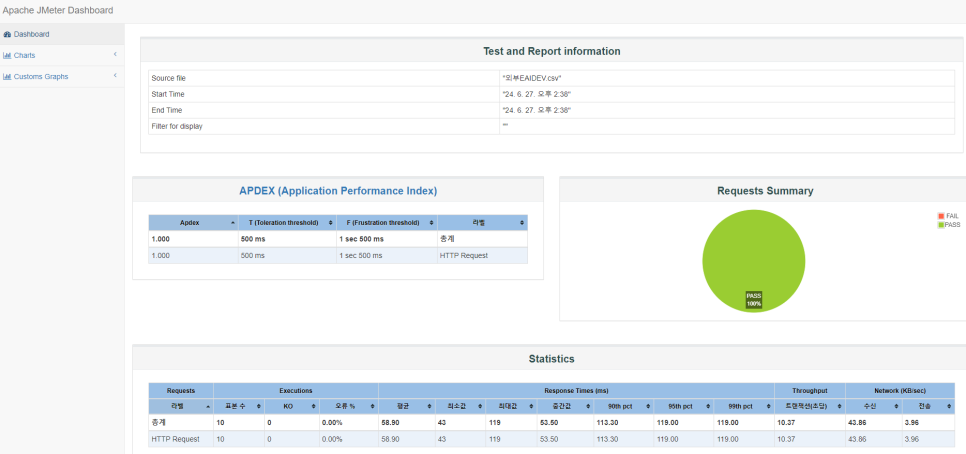
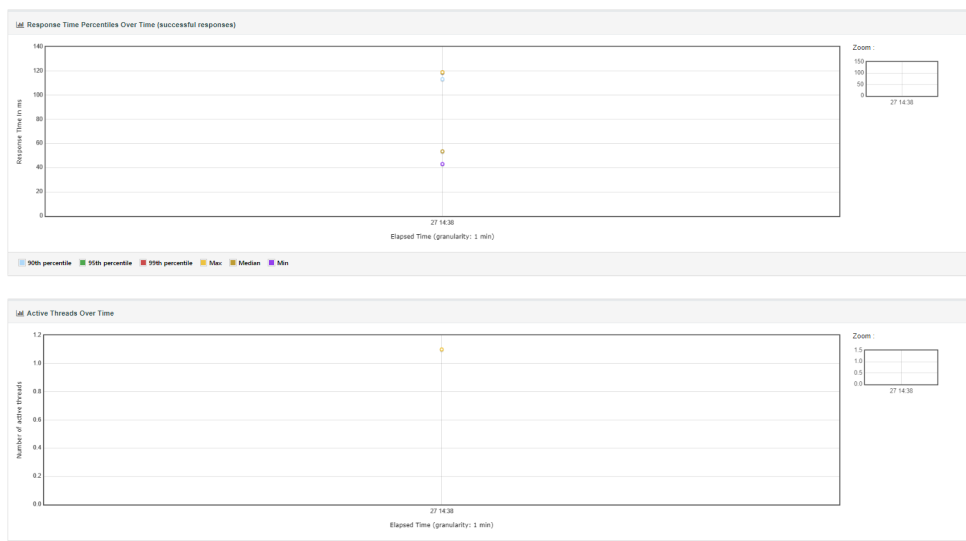
JMeter can also generate an HTML report. Create an empty CSV file and select it. For user properties, pick jmeter.properties under the bin directory. The Output directory must be an empty folder; create one and select it, then click Generate report. Open index.html in that folder for a polished report. Increasing the request count makes the charts more meaningful.
Leave a Reply