When should you read this?
You already run Spring Boot on ECS Fargate, read container logs in CloudWatch, and alarm on ALB 5xx. ALB 5xx catches "the load balancer gave up." Resource pressure is a different failure: CPU pegged, memory climbing, tasks restarting – often before ELB 5xx spikes.
This post is that signal. Two alarms on the ECS service: CPUUtilization and MemoryUtilization. When either stays high, open the matching task stream under /ecs/api.
What you are building
One job today:
- Confirm
ClusterNameandServiceNamefor the api service. - (Optional) Peek current averages with
get-metric-statistics. put-metric-alarmfor CPU and for memory onAWS/ECS.- Confirm with
describe-alarms.
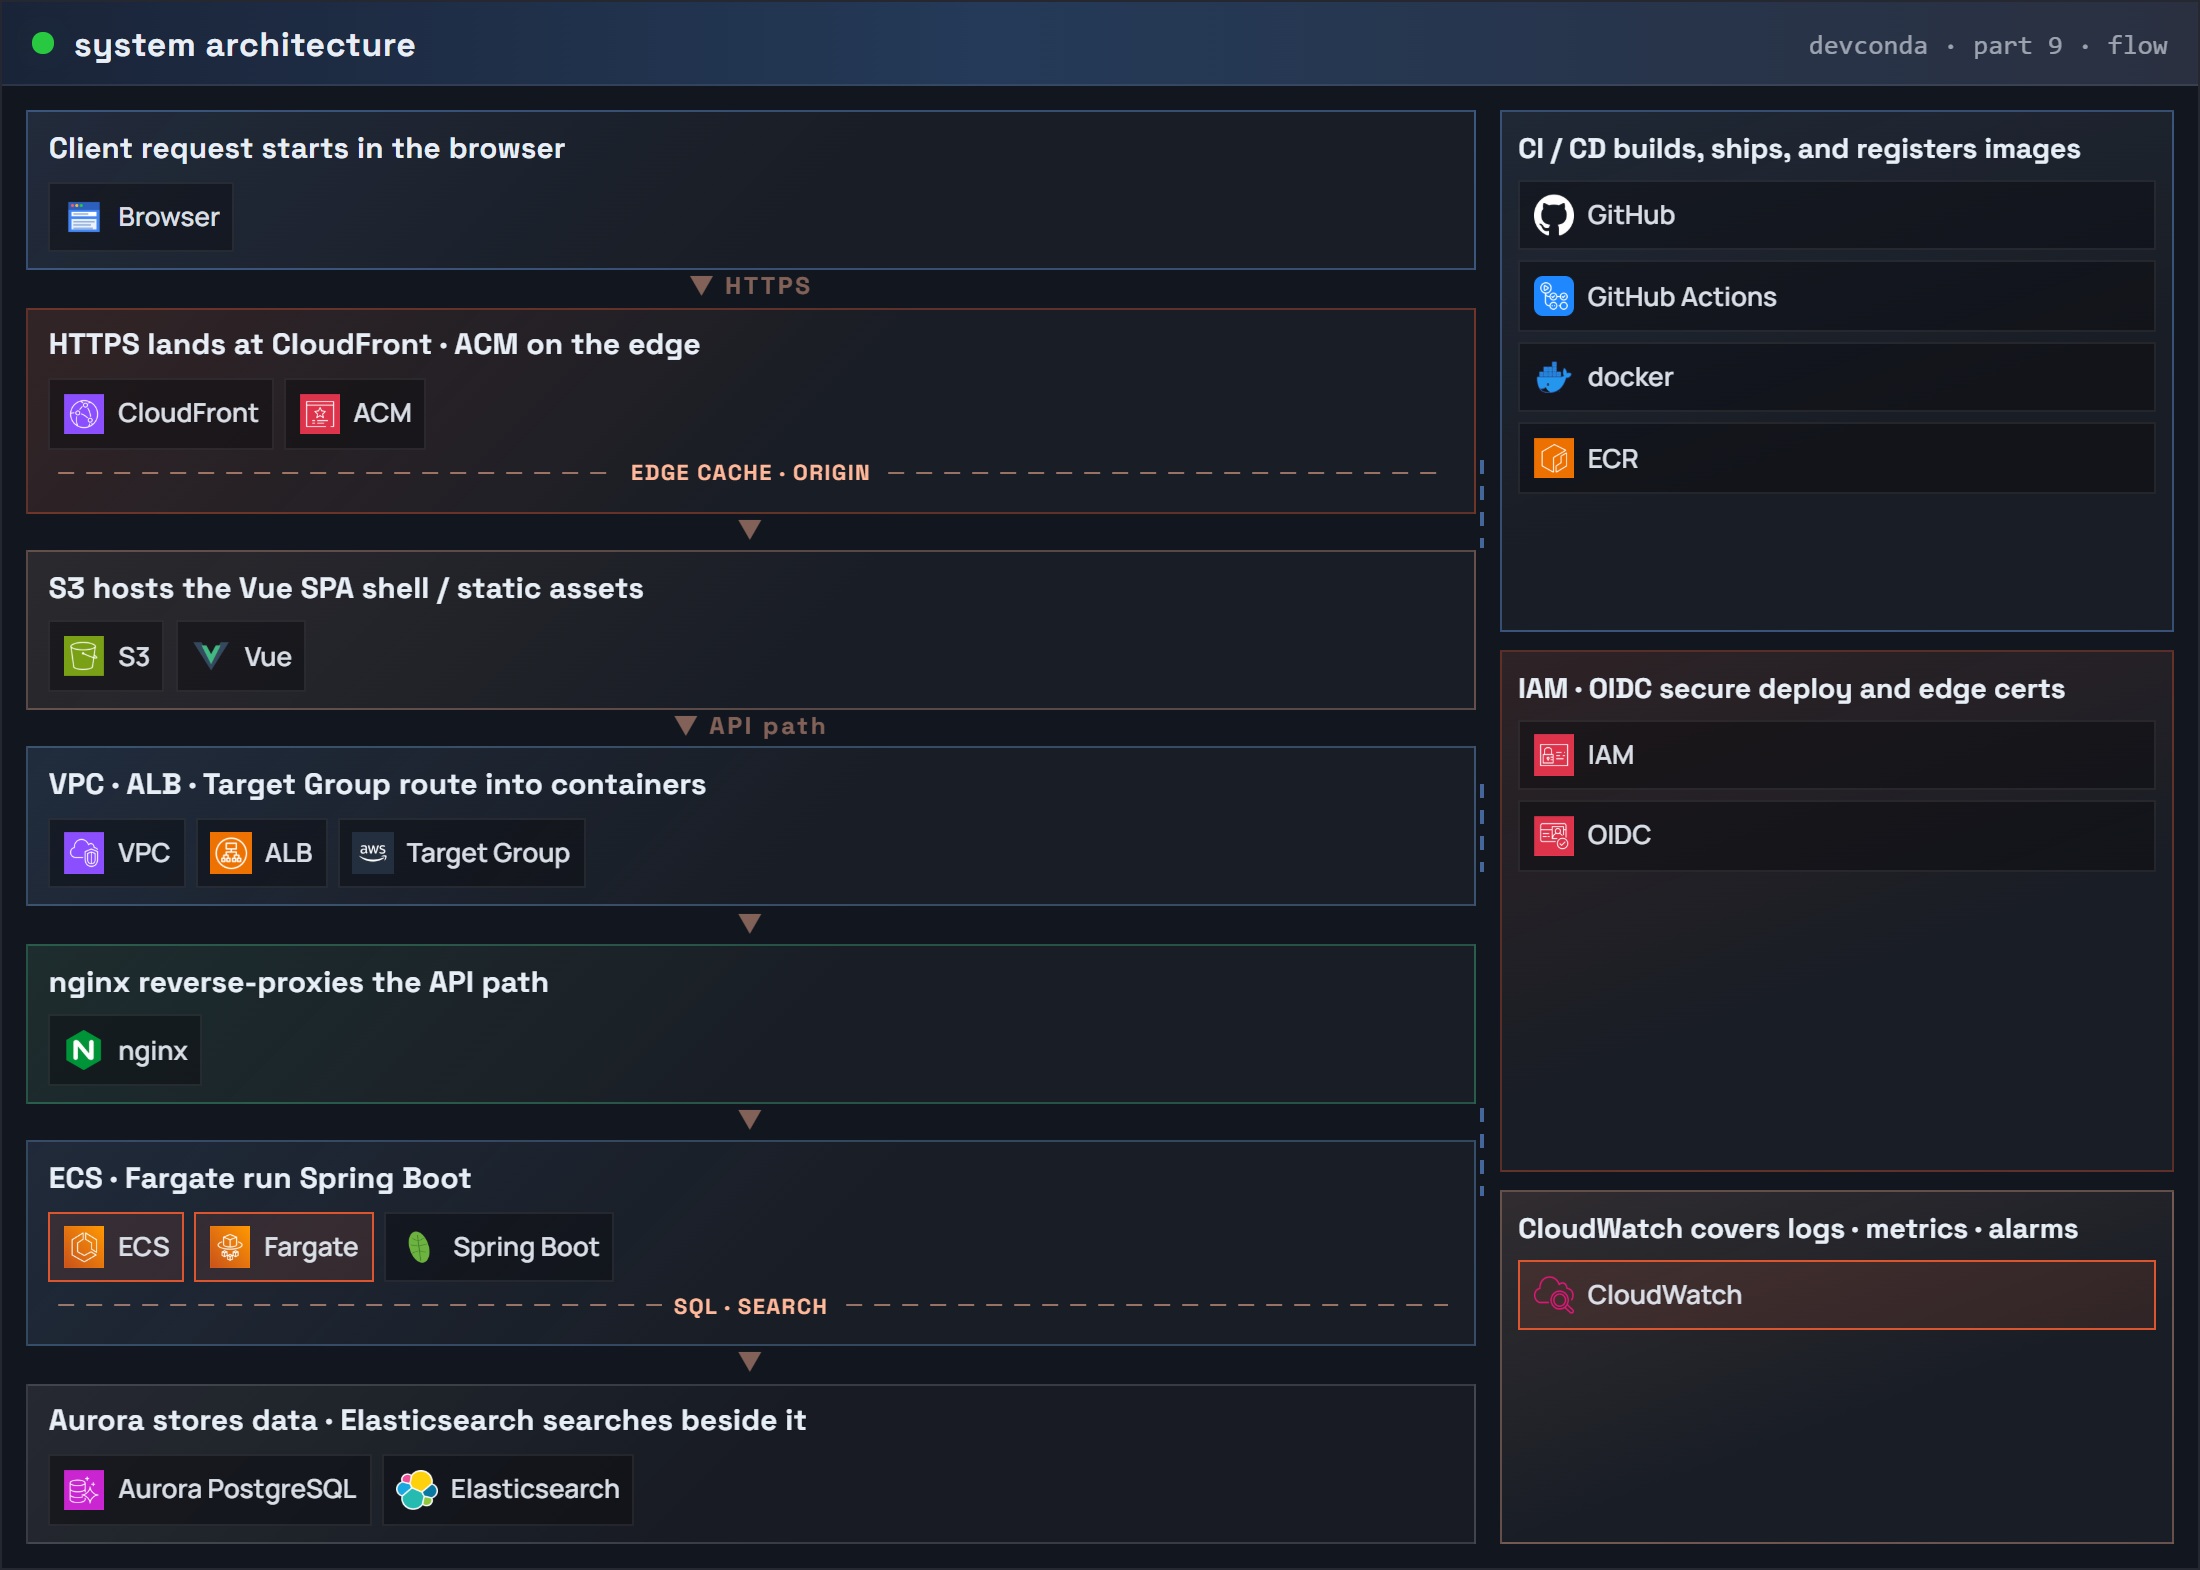
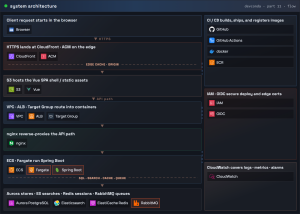
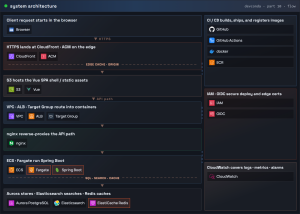
Part 9: system architecture (request flow) – ECS CPU and memory alarms
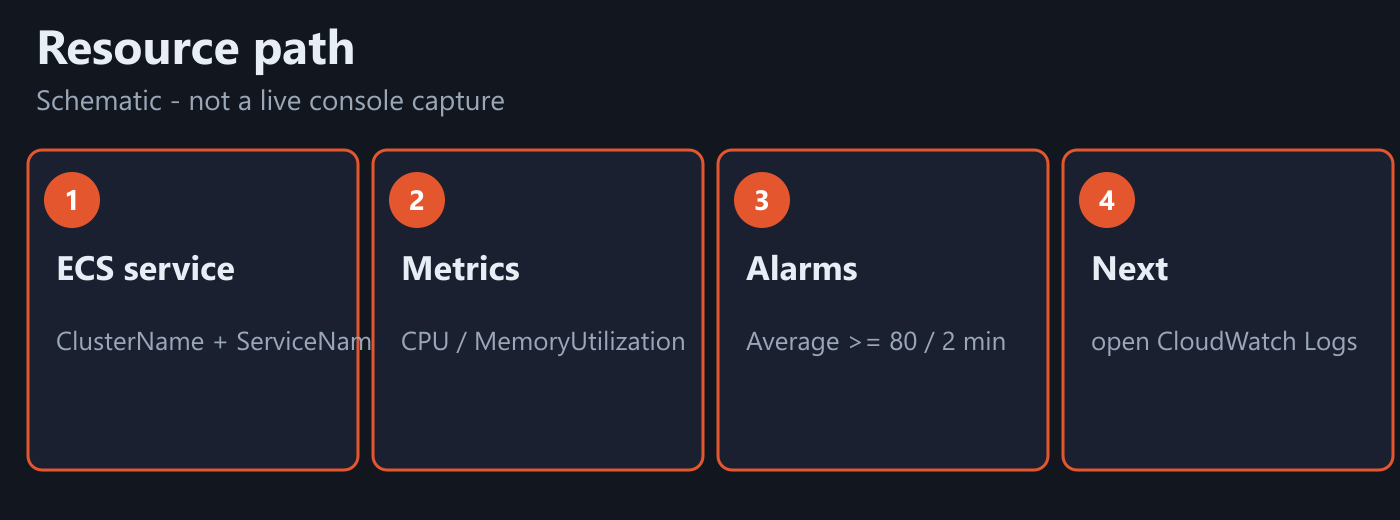
Resource path (schematic):
1) Confirm cluster and service names
REGION=ap-northeast-2
CLUSTER=api
SERVICE=api

aws ecs describe-services \
  --cluster $CLUSTER \
  --services $SERVICE \
  --region $REGION \
  --query 'services[0].[serviceName,status,desiredCount,runningCount]' \
  --output text
CloudWatch dimensions for default ECS service metrics are those two strings – not the task ARN.
2) Peek the metrics (optional)
END=$(date -u +%Y-%m-%dT%H:%M:%SZ)
START=$(date -u -d '1 hour ago' +%Y-%m-%dT%H:%M:%SZ 2>/dev/null || date -u -v-1H +%Y-%m-%dT%H:%M:%SZ)

aws cloudwatch get-metric-statistics \
  --namespace AWS/ECS \
  --metric-name CPUUtilization \
  --dimensions Name=ClusterName,Value=$CLUSTER Name=ServiceName,Value=$SERVICE \
  --start-time $START --end-time $END \
  --period 60 --statistics Average \
  --region $REGION

aws cloudwatch get-metric-statistics \
  --namespace AWS/ECS \
  --metric-name MemoryUtilization \
  --dimensions Name=ClusterName,Value=$CLUSTER Name=ServiceName,Value=$SERVICE \
  --start-time $START --end-time $END \
  --period 60 --statistics Average \
  --region $REGION
On Windows PowerShell, build $START / $END with Get-Date UTC instead of date -d. Empty datapoints usually mean wrong cluster/service name or the service has not run long enough in this region.
3) Put CPU and memory alarms
aws cloudwatch put-metric-alarm \
  --alarm-name api-ecs-cpu-high \
  --alarm-description "ECS service CPU high; then read /ecs/api streams" \
  --namespace AWS/ECS \
  --metric-name CPUUtilization \
  --dimensions Name=ClusterName,Value=$CLUSTER Name=ServiceName,Value=$SERVICE \
  --statistic Average \
  --period 60 \
  --evaluation-periods 2 \
  --threshold 80 \
  --comparison-operator GreaterThanOrEqualToThreshold \
  --treat-missing-data notBreaching \
  --region $REGION

aws cloudwatch put-metric-alarm \
  --alarm-name api-ecs-memory-high \
  --alarm-description "ECS service memory high; then read /ecs/api streams" \
  --namespace AWS/ECS \
  --metric-name MemoryUtilization \
  --dimensions Name=ClusterName,Value=$CLUSTER Name=ServiceName,Value=$SERVICE \
  --statistic Average \
  --period 60 \
  --evaluation-periods 2 \
  --threshold 80 \
  --comparison-operator GreaterThanOrEqualToThreshold \
  --treat-missing-data notBreaching \
  --region $REGION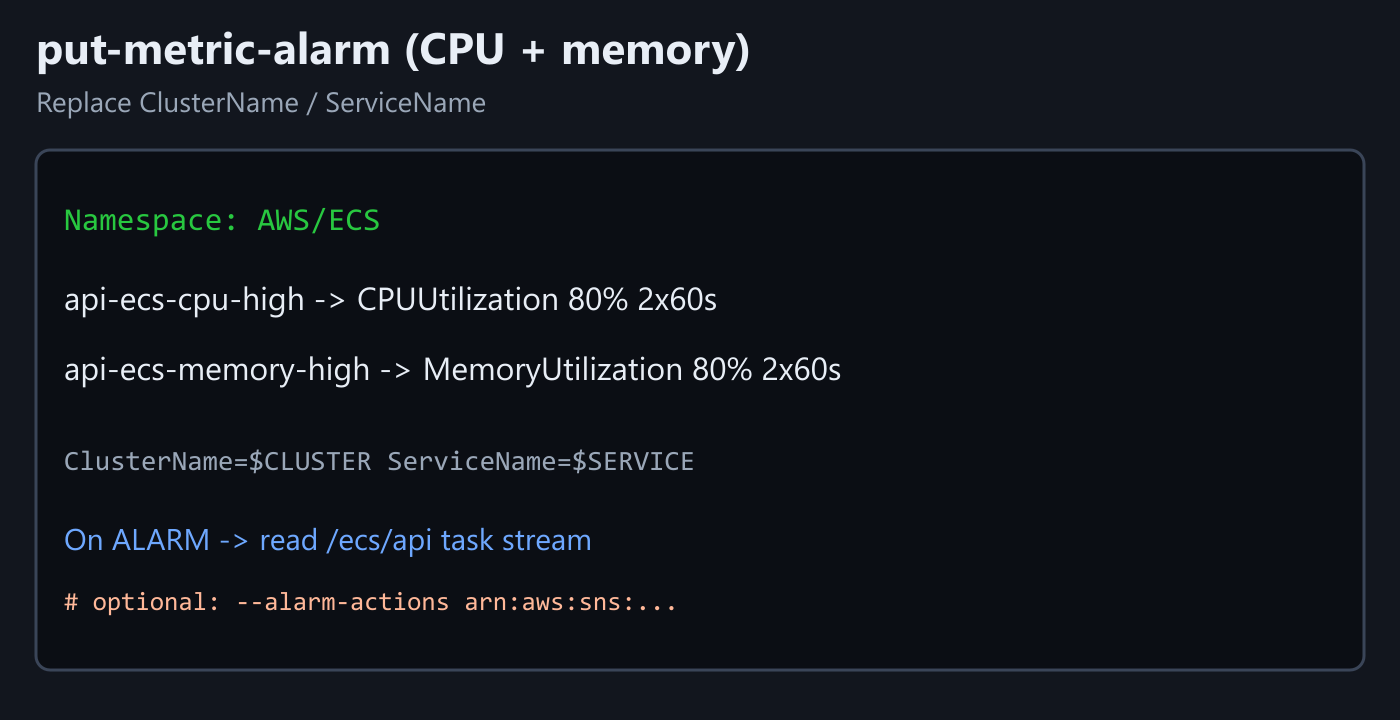
Why Average / 2 periods / 80%: one noisy minute should not page you; two straight minutes at or above 80% of the task’s CPU or memory reservation is enough to investigate. Tighten or loosen threshold to match your task size – these numbers are a starting point, not a platform SLA.
Optional: add --alarm-actions arn:aws:sns:region:account:topic if you already have an SNS topic. Without it, the alarm still changes state in CloudWatch; you just will not get SMS/email.
4) Verify
aws cloudwatch describe-alarms \
  --alarm-names api-ecs-cpu-high api-ecs-memory-high \
  --region $REGION \
  --query 'MetricAlarms[*].[AlarmName,StateValue,MetricName,Threshold,Dimensions]' \
  --output json
Expect both metric names, ClusterName/ServiceName matching yours, state usually OK when the service is idle-healthy.
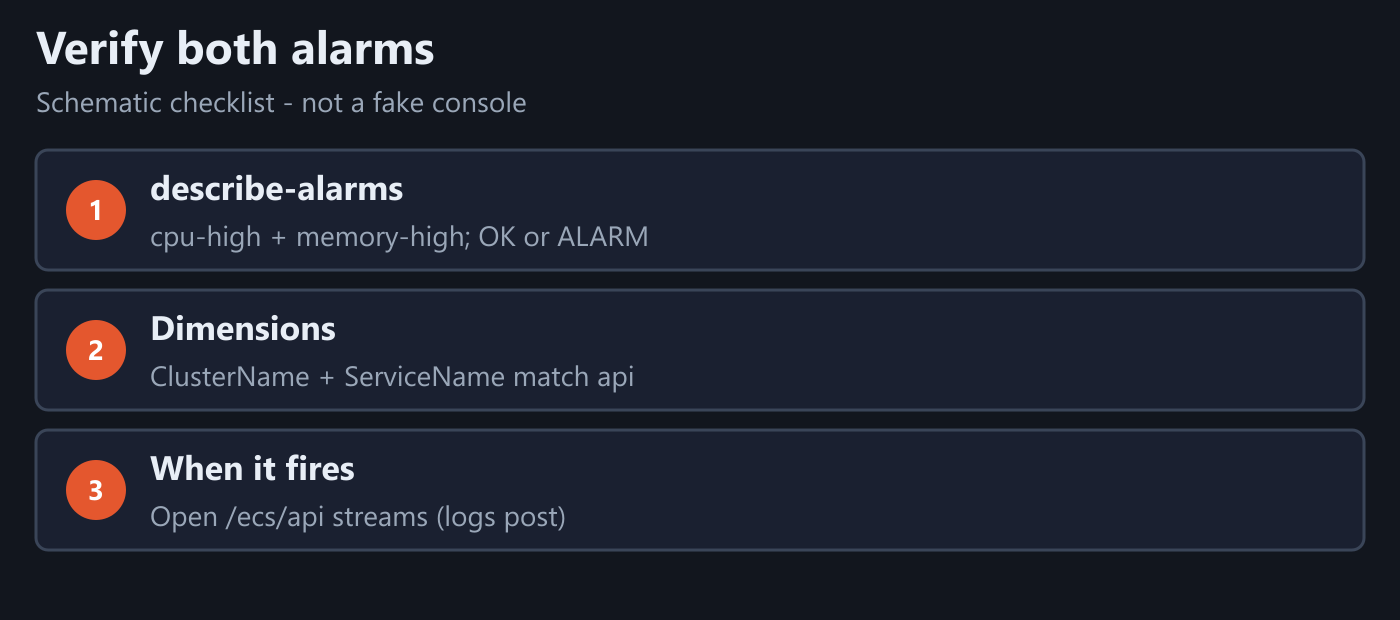
When either alarm goes to ALARM: open ECS Tasks, grab the hot (or recently STOPPED) task id, then follow Read Fargate Container Logs in CloudWatch. If logs show a leak or a tight heap, raise task memory/CPU on the task definition and redeploy – do not only silence the alarm.
If alarms never move while get-metric-statistics already shows high values: wrong alarm dimensions, or you are watching a different service name than the one under load.
Minimal checklist
CLUSTER/SERVICEmatch the running api service.- Optional peek shows
CPUUtilization/MemoryUtilizationdatapoints. - Alarms
api-ecs-cpu-highandapi-ecs-memory-highexist (Average / 60s / 2 / 80). - On ALARM – read the task stream under
/ecs/api, then fix size or the app.
After that, Fargate resource pressure is visible in CloudWatch before it only shows up as user complaints.
Leave a Reply