When should you read this?
You already put ALB HTTPS in front of Fargate Spring Boot and read Fargate container logs in CloudWatch. You can open /ecs/api streams by hand. What you still lack is a clear signal: when should you open them?
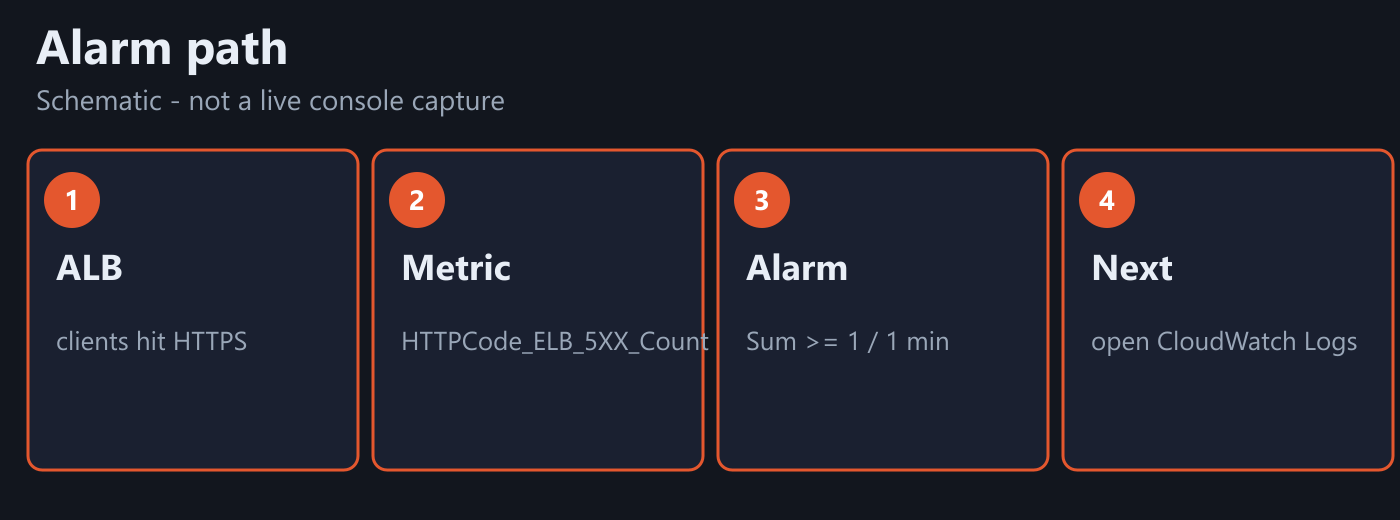
This post is that signal. One CloudWatch alarm on ALB-generated 5xx (HTTPCode_ELB_5XX_Count). When the load balancer returns 502/503/504, the alarm goes to ALARM. Then you go to the logs post and read the matching task stream. ECS CPU/memory alarms stay a later post.
What you are building
One alarm today:
- Find your ALB’s
LoadBalancerdimension (app/name/id). put-metric-alarmonAWS/ApplicationELB/HTTPCode_ELB_5XX_Count(Sum, 60s, threshold 1).- Confirm with
describe-alarms.
You are not rebuilding the ALB. You are not wiring ECS CPU alarms here.
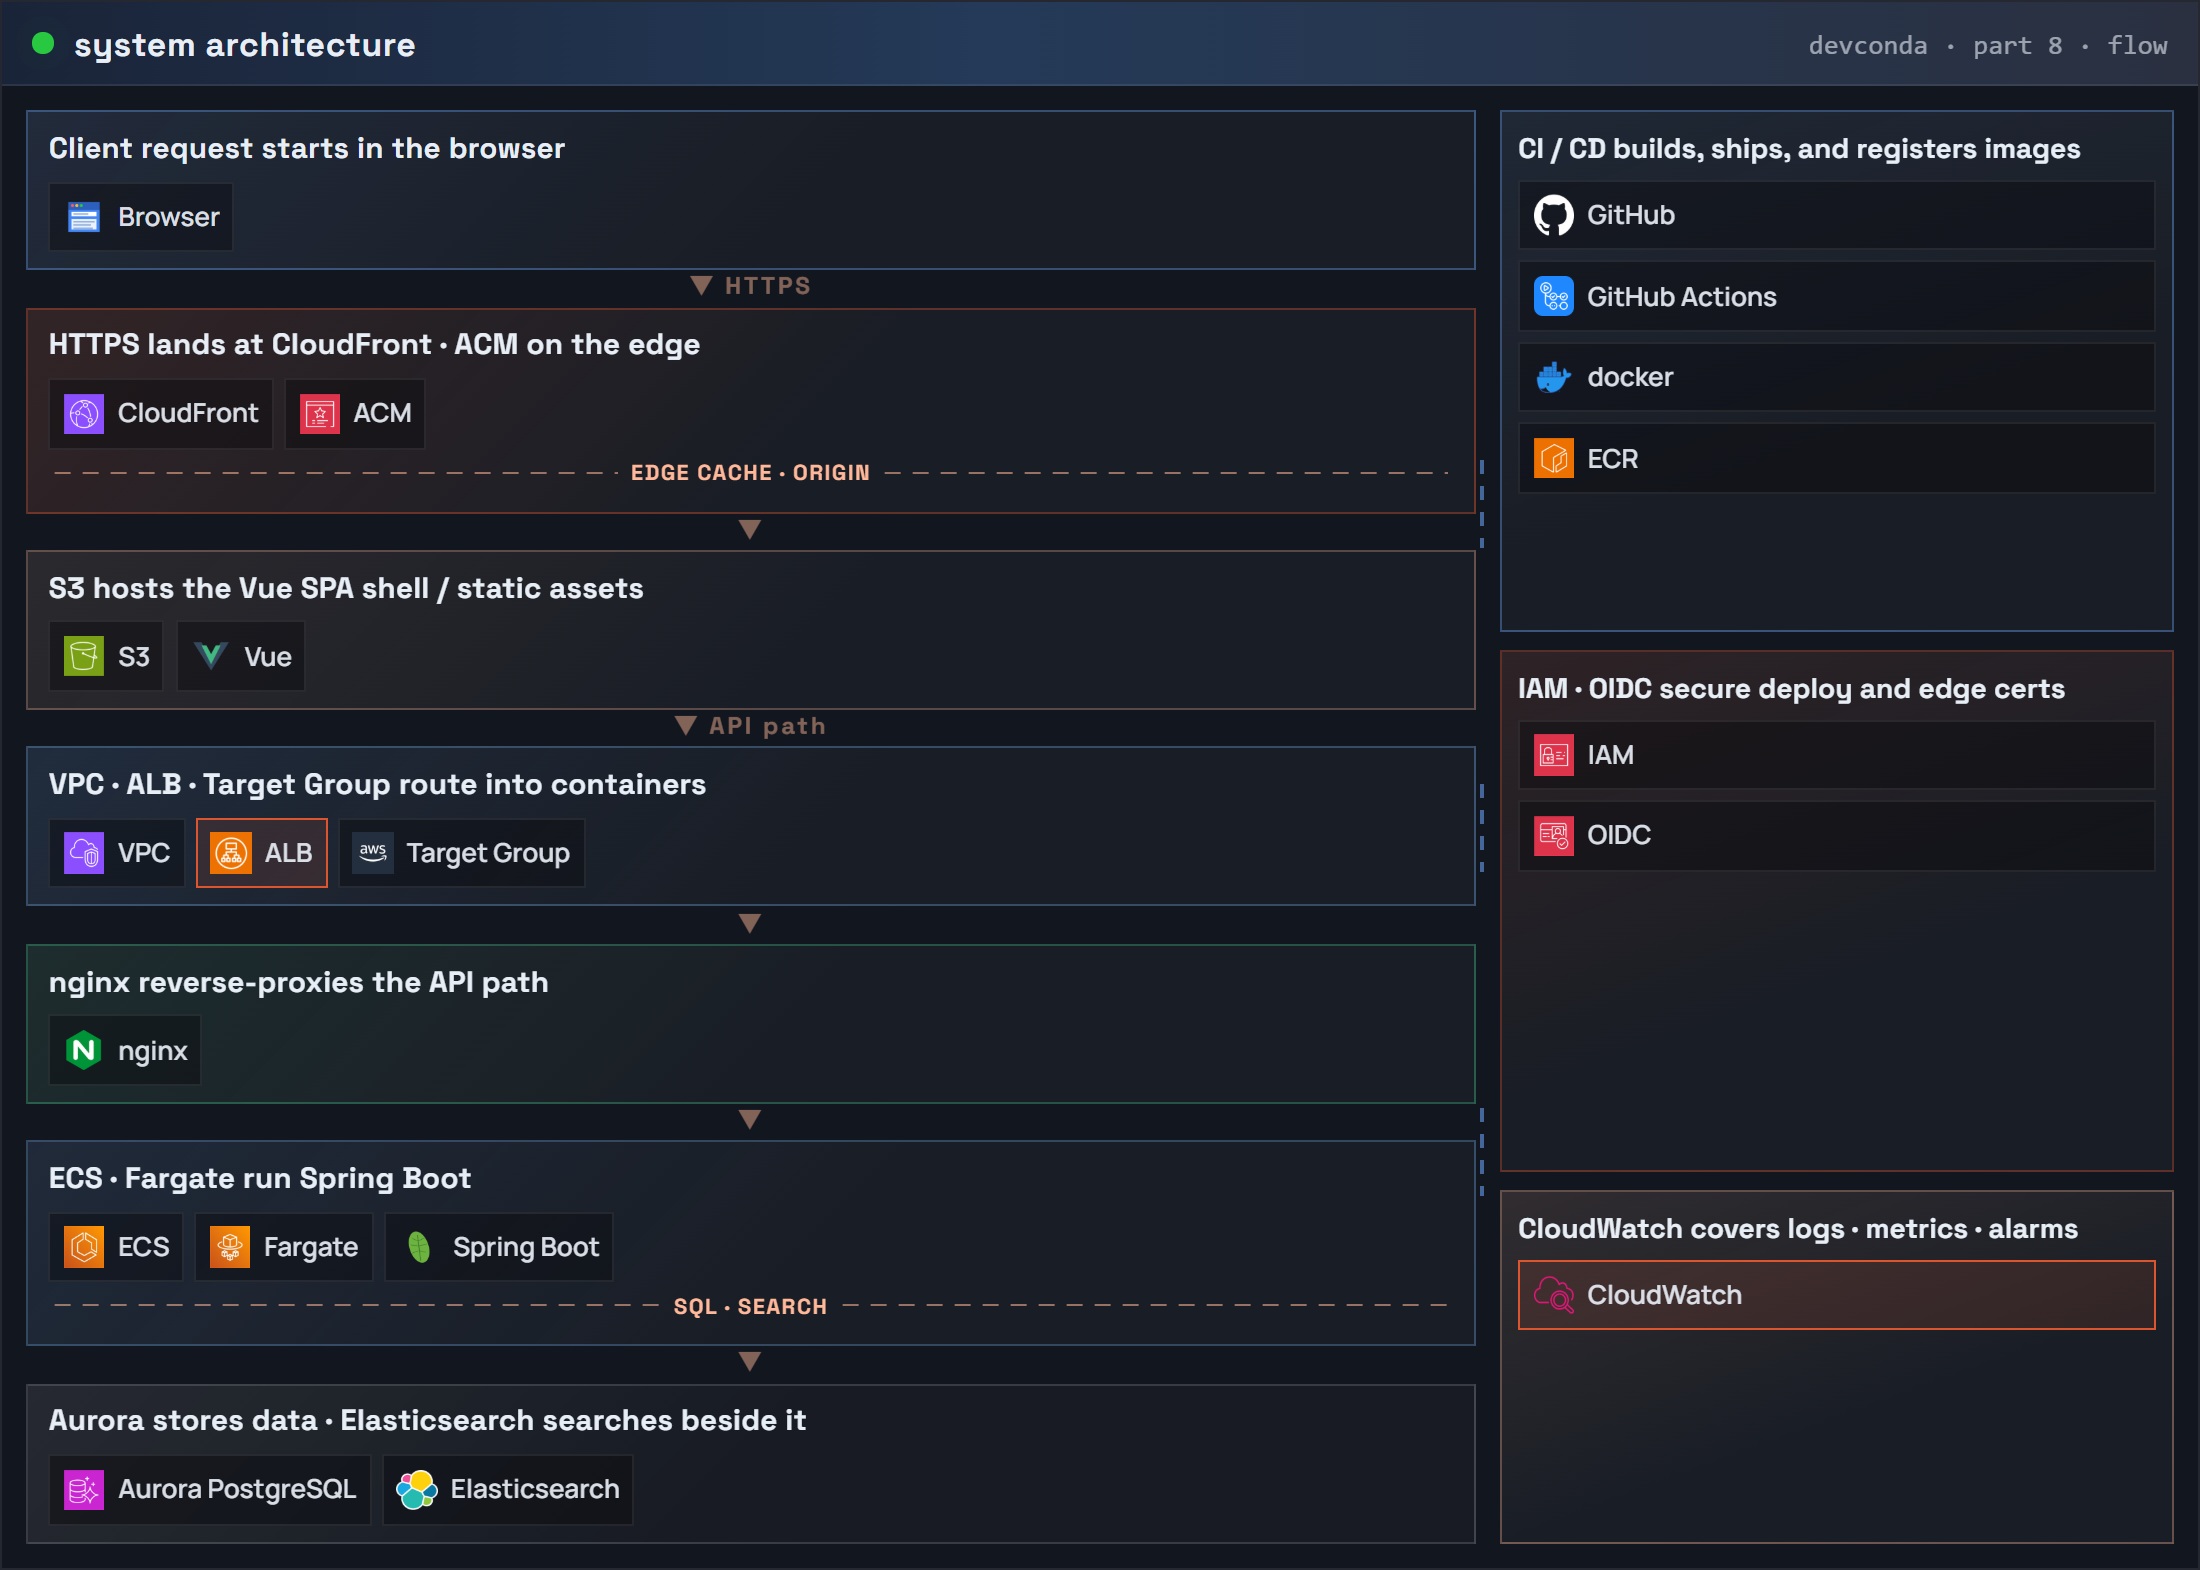
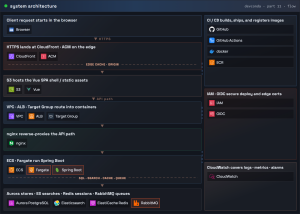
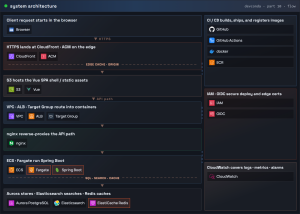
Part 8: system architecture (request flow) – ALB 5xx alarm
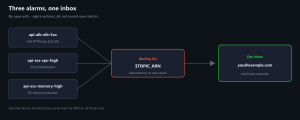
Alarm path (schematic):
1) Get the LoadBalancer dimension
REGION=ap-northeast-2

# List ALBs; copy the one in front of your api service
aws elbv2 describe-load-balancers \
  --region $REGION \
  --query 'LoadBalancers[*].[LoadBalancerName,LoadBalancerArn]' \
  --output table
The CloudWatch dimension is not the full ARN. It is the suffix after loadbalancer/:
app/<name>/<id>
Example shape (use yours):
LB_DIM=app/api/0123456789abcdefFrom an ARN like arn:aws:elasticloadbalancing:...:loadbalancer/app/api/0123..., take everything after loadbalancer/.
2) Put the 5xx alarm
aws cloudwatch put-metric-alarm \
  --alarm-name api-alb-elb-5xx \
  --alarm-description "ALB-generated 5xx for api; then read /ecs/api streams" \
  --namespace AWS/ApplicationELB \
  --metric-name HTTPCode_ELB_5XX_Count \
  --dimensions Name=LoadBalancer,Value=$LB_DIM \
  --statistic Sum \
  --period 60 \
  --evaluation-periods 1 \
  --threshold 1 \
  --comparison-operator GreaterThanOrEqualToThreshold \
  --treat-missing-data notBreaching \
  --region $REGION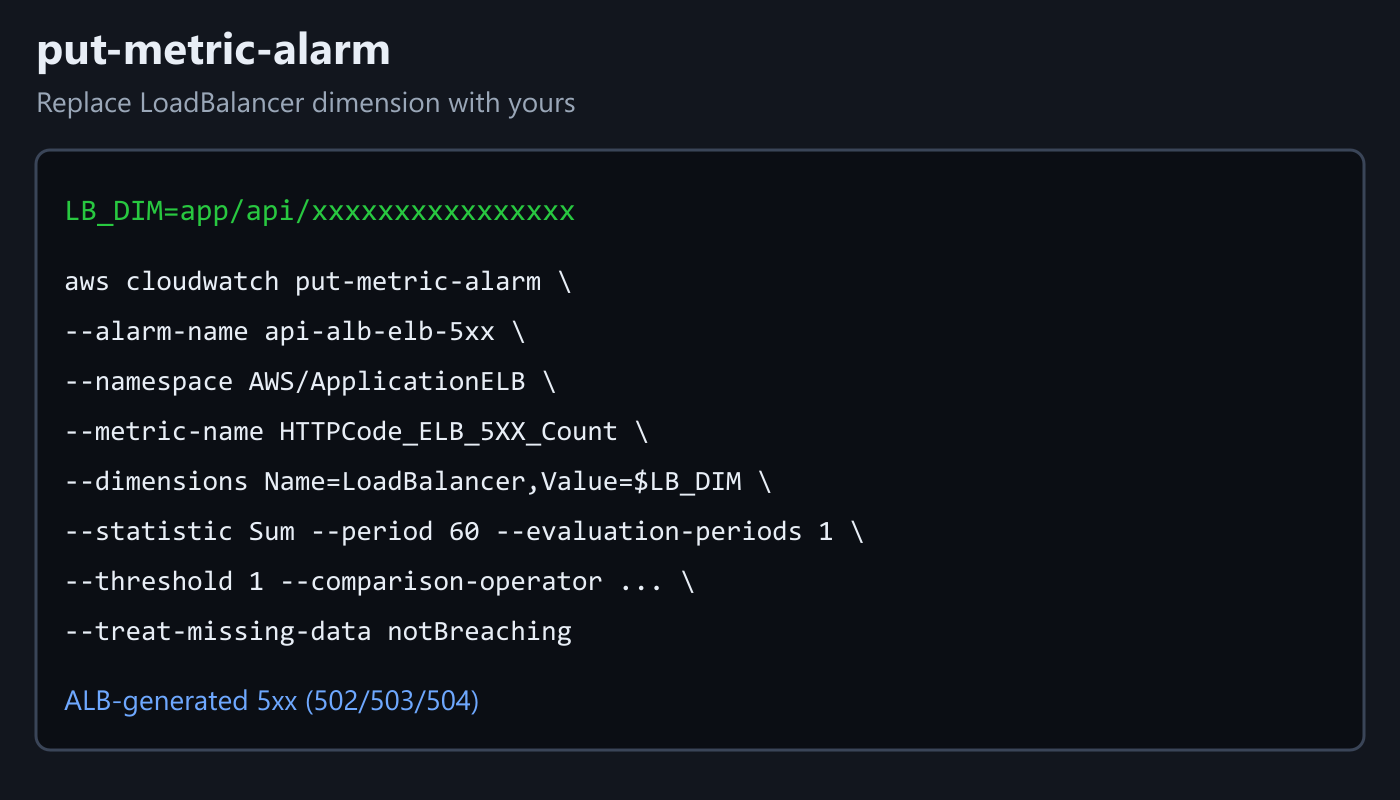
Why this metric: HTTPCode_ELB_5XX_Count is 5xx generated by the load balancer (typical 502/503/504 when targets are unhealthy, timed out, or connection failed). That is the "browser/ALB 502" case from the logs post.
Target-generated 5xx (HTTPCode_Target_5XX_Count) is a different metric – Spring returned 5xx itself. You can add a second alarm later; this post finishes one ELB 5xx alarm.
Optional: add --alarm-actions arn:aws:sns:region:account:topic if you already have an SNS topic. Without it, the alarm still changes state in CloudWatch; you just will not get SMS/email.
3) Verify
aws cloudwatch describe-alarms \
  --alarm-names api-alb-elb-5xx \
  --region $REGION \
  --query 'MetricAlarms[0].[AlarmName,StateValue,MetricName,Threshold,Dimensions]' \
  --output json
Expect MetricName=HTTPCode_ELB_5XX_Count, your LoadBalancer dimension, state usually OK when traffic is healthy.
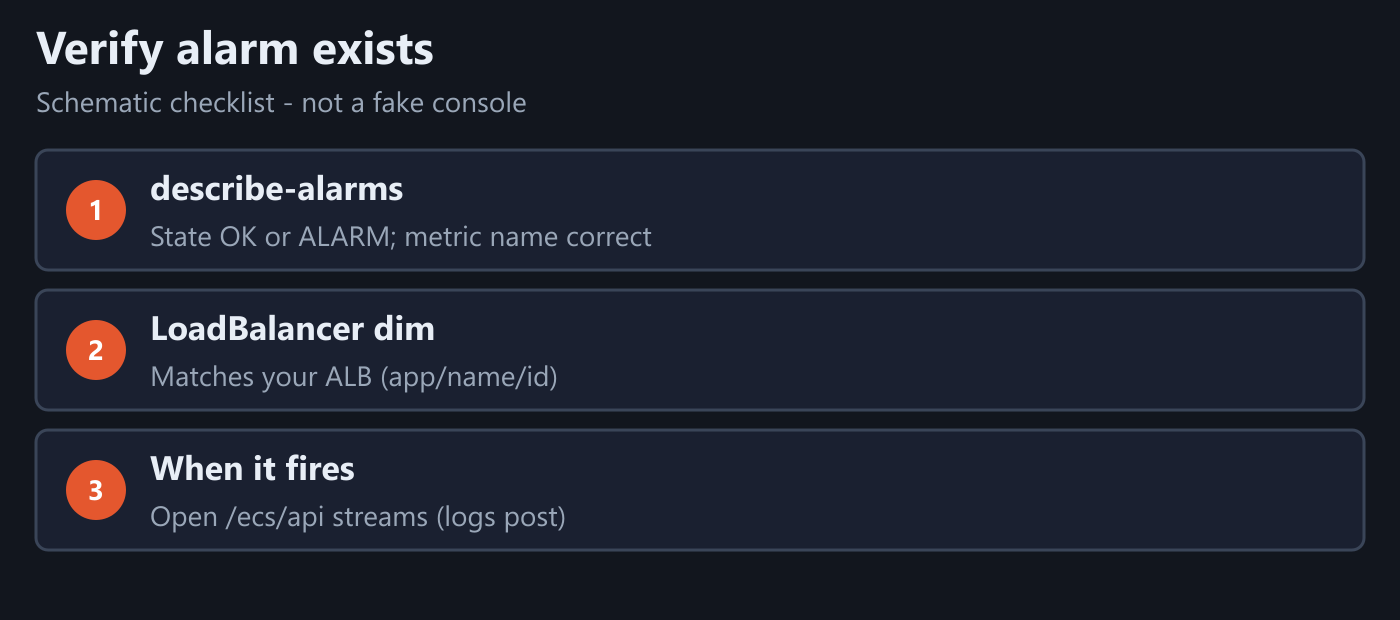
When the alarm goes to ALARM: open ECS, grab the failing (often STOPPED) task id, then follow Read Fargate Container Logs in CloudWatch on /ecs/api.
If the alarm never moves and you know clients got 502: wrong LB_DIM, wrong region, or you are looking at Target 5xx while ELB 5xx stayed zero – check both metrics in CloudWatch before rewriting the alarm.
Minimal checklist
LB_DIM=app/<name>/<id>matches the ALB in front of the api service.- Alarm
api-alb-elb-5xxexists onHTTPCode_ELB_5XX_Count(Sum / 60s / threshold 1). describe-alarmsshows the right dimension; state OK when healthy.- On ALARM – go to the logs post and read the task stream under
/ecs/api.
After that, ALB 5xx is no longer something you notice only when a user complains – CloudWatch tells you, then you read the stream.
Leave a Reply